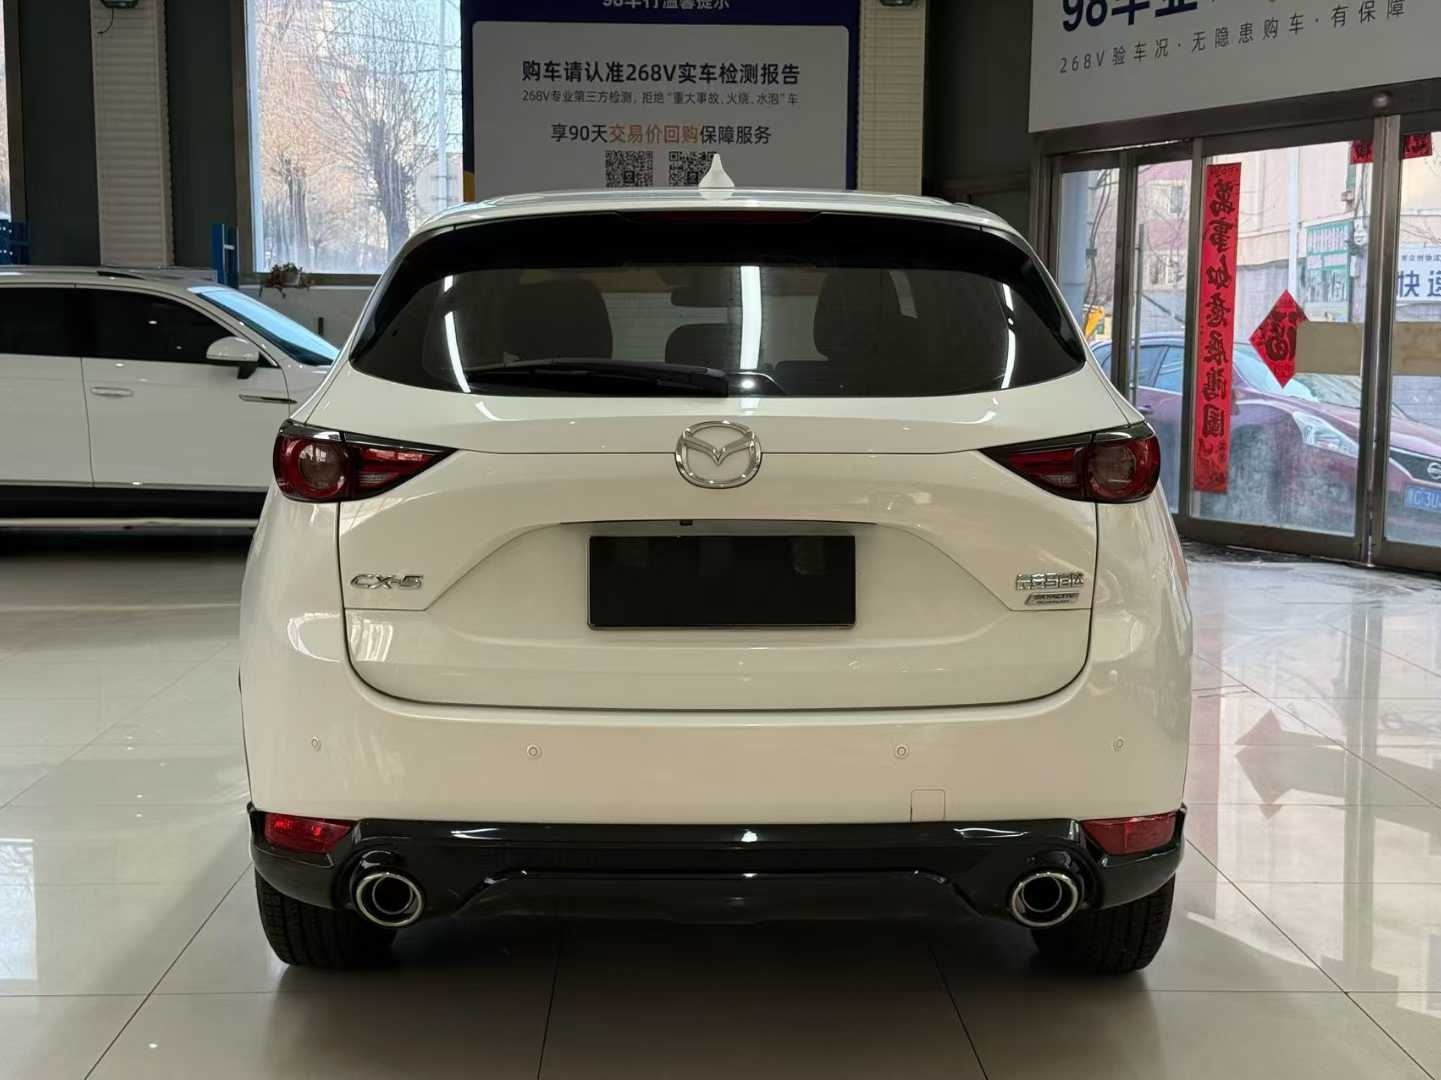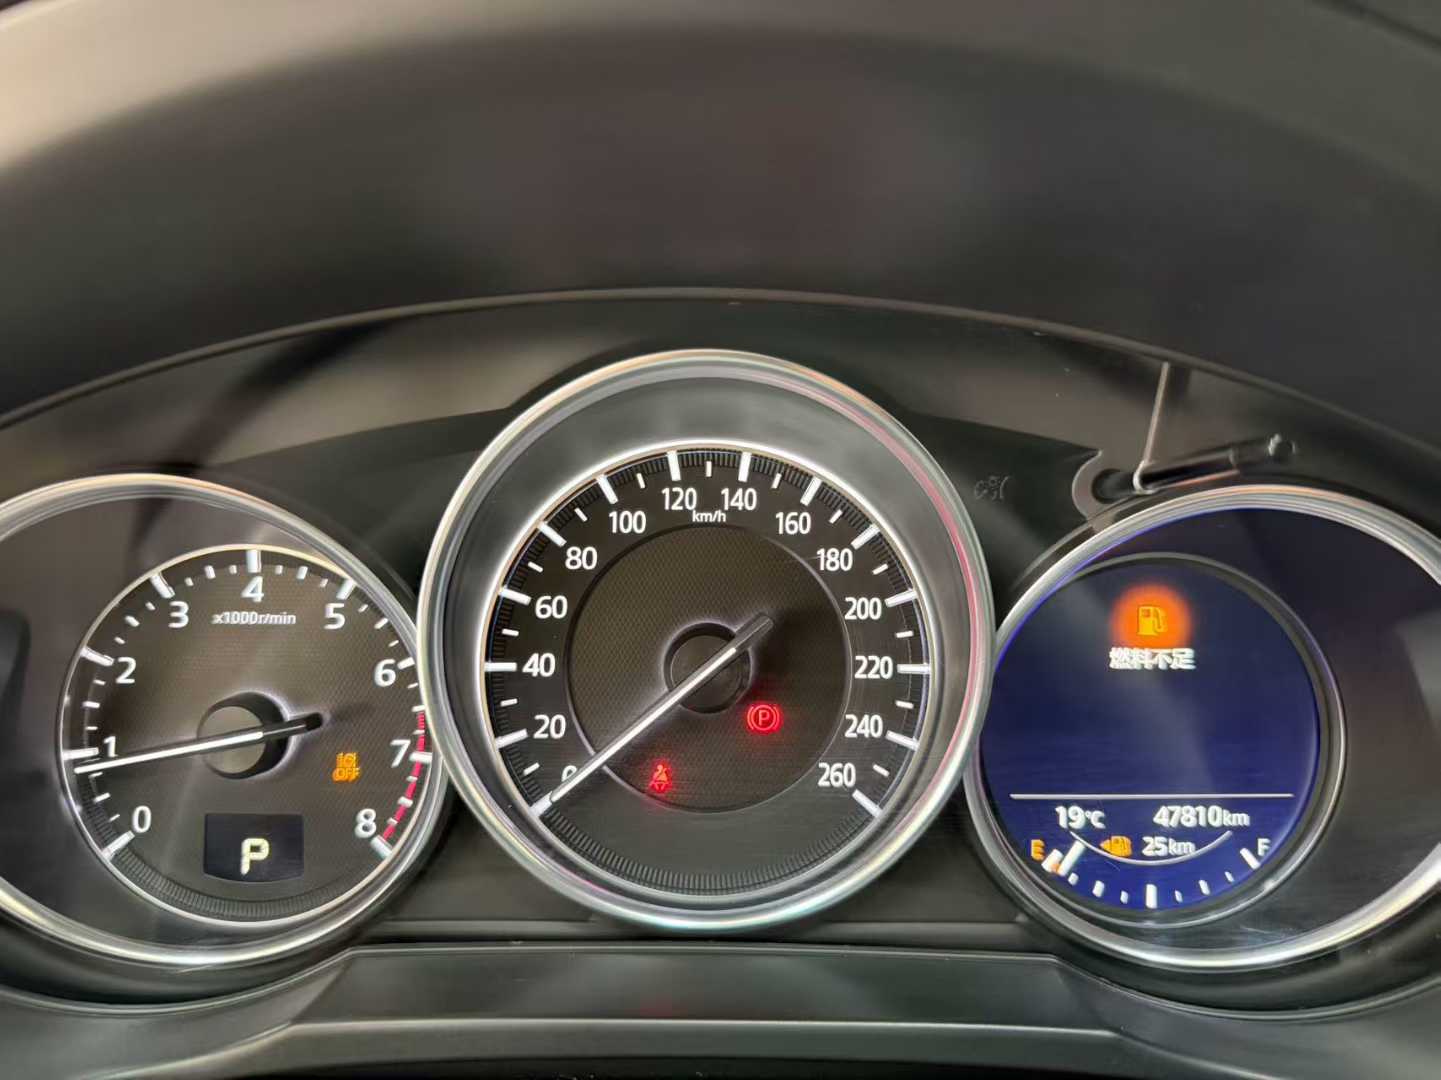

Identify the test basis
Record engine, transmission, drivetrain, wheel size, market and whether the figure uses WLTP, NEDC, ADR or another cycle. Figures from unlike cycles should not be ranked directly.
Model the buyer’s route
Urban congestion, cold starts, hills, speed, passengers, tyres, climate control and AWD can change real use. Build a range for the intended route instead of quoting one decimal.
Use condition as a cost input
Incorrect tyre pressure, alignment, dragging brakes, warning faults and overdue service may raise consumption. Inspect the car before treating fuel use as a model characteristic.
Quick answer
CX-5 fuel consumption must be estimated for an identified engine, drivetrain and route. Test-cycle figures are useful for comparing like versions, while real use also depends on traffic, speed, temperature, load, tyres, AWD, maintenance and driver behaviour.
Turn consumption into a buyer-specific estimate
Begin with an official figure for the same engine, drivetrain, transmission, wheel specification and market. Label its test cycle. The number creates a comparison baseline, but it should not be presented as the result a used vehicle will achieve after export.
Build a low, expected and high-use case from the buyer’s annual distance and route. Separate city congestion, short cold journeys, open-road driving and high-speed motorway use. Add passenger load, hills, climate control and seasonal temperature where they materially affect the route.
After purchase, measure full-tank consumption over several representative refills rather than relying on one dashboard trip. Before blaming the vehicle design, check pressures, tyre size, alignment, brake drag, service condition and diagnostic faults.
Calculate annual fuel cost without false precision
Use annual distance multiplied by an expected consumption range and current local fuel price. Keep litres per 100 kilometres, miles per gallon and currency units consistent. Where fuel grades differ, use the grade required by the exact market specification rather than the cheapest pump price.
Run sensitivity cases for city-heavy use, motorway-heavy use and a higher-consumption condition. A difference that appears large per 100 kilometres may be small at low annual mileage, while a modest gap can matter to a high-distance fleet.
Record the assumptions beside the result: model year, engine, FWD or AWD, wheel size, route split, load and fuel price date. The estimate can then be updated when a real VIN is shortlisted instead of being copied as a permanent claim.
Decision table
What to verify before choosing
- 01Record the exact market and test cycle beside every published figure; do not mix WLTP, NEDC, ADR and owner-reported numbers.
- 02Calculate fuel cost with a realistic range for the buyer’s route, local fuel price and annual distance.
- 03Check tyre size, pressure and wear, wheel alignment, brake drag, air filter, scan data and warning faults on the actual vehicle.
- 04Compare petrol, diesel, displacement and AWD only after normalising year, condition and driving pattern.
A practical action plan
Vehicle identity
Record the exact market and test cycle beside every published figure; do not mix WLTP, NEDC, ADR and owner-reported numbers.
Published basis
Calculate fuel cost with a realistic range for the buyer’s route, local fuel price and annual distance.
Route model
Check tyre size, pressure and wear, wheel alignment, brake drag, air filter, scan data and warning faults on the actual vehicle.
Condition check
Compare petrol, diesel, displacement and AWD only after normalising year, condition and driving pattern.
Which buyer profile fits?
Scenario 1
An urban short-trip buyer should model cold starts, congestion and air-conditioning rather than highway brochure figures.
Scenario 2
A motorway-distance buyer should compare steady-speed consumption, tank range and fuel availability.
Scenario 3
A fleet buyer should measure several vehicles on a repeatable route after establishing comparable tyre and service condition.
How to compare shortlisted vehicles
| Decision area | Target | Weight |
|---|---|---|
| Vehicle identity | Engine, transmission, FWD/AWD, model year and wheel size | Mandatory match |
| Published basis | Market brochure and named test cycle | High priority |
| Route model | Urban share, speed, hills, temperature, load and distance | Cost and risk |
| Condition check | Tyres, alignment, brakes, fluids, faults and overdue service | Final confirmation |
Mistakes that create avoidable cost
- Promising one universal litres-per-100-kilometres figure.
- Comparing unlike test cycles as if they were measured together.
- Ignoring AWD, wheel, load and route differences.
- Blaming the model before checking condition and driving pattern.
Frequently asked questions
What fuel economy does a Mazda CX-5 get?
It varies by engine, drivetrain, market, test cycle and use; use the matching brochure and a route-specific estimate.
Does AWD use more fuel?
It can add mass and driveline losses, but the exact difference depends on version and test basis.
Can a used-car inspection predict consumption?
It cannot guarantee a number, but it can identify faults and wear likely to distort normal use.
Should I trust dashboard average consumption?
Use it as one clue only; reset history, route and idling can make the displayed average unrepresentative.
Reference sources
Official information is used to understand the model family. The individual VIN, documents and inspection remain authoritative for a vehicle offered for sale.
Verify the exact vehicle
Specifications vary by year and market. Match the VIN, vehicle documents, inspection findings and manufacturer service information before purchase.